SEAMLESS-WAVE

SEAMLESS-WAVE is a developing “SoftwarE infrAstructure for Multi-purpose fLood modElling at variouS scaleS” based on "WAVElets" and their versatile properties. The vision behind SEAMLESS-WAVE is to produce an intelligent and holistic modelling framework, which can drastically reduce iterations in building and testing for an optimal model setting, and in controlling the propagation of model-error due to scaling effects and of uncertainty due statistical inputs.
Running the code, outputs and visualisation
After following the instructions within “Compilation”, a LISFLOOD-FP executable file will be obtained. The executable file will have the name lisflood.exe on a Windows platform and the name lisflood on a Linux-based platform.
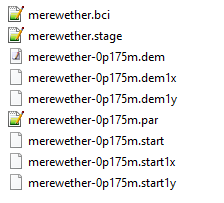
For running the lisflood.exe of the Merewether test case on Windows, create a directory for the test case, for example named merewether, inside the same directory where lisflood.exe is located. Then place the input files (For UoS users available in the testing\UoS\T04 directory of LISFLOOD-FP-trunk repository; and for external users available in Data\T04) inside the merewether directory as shown in the figure below.
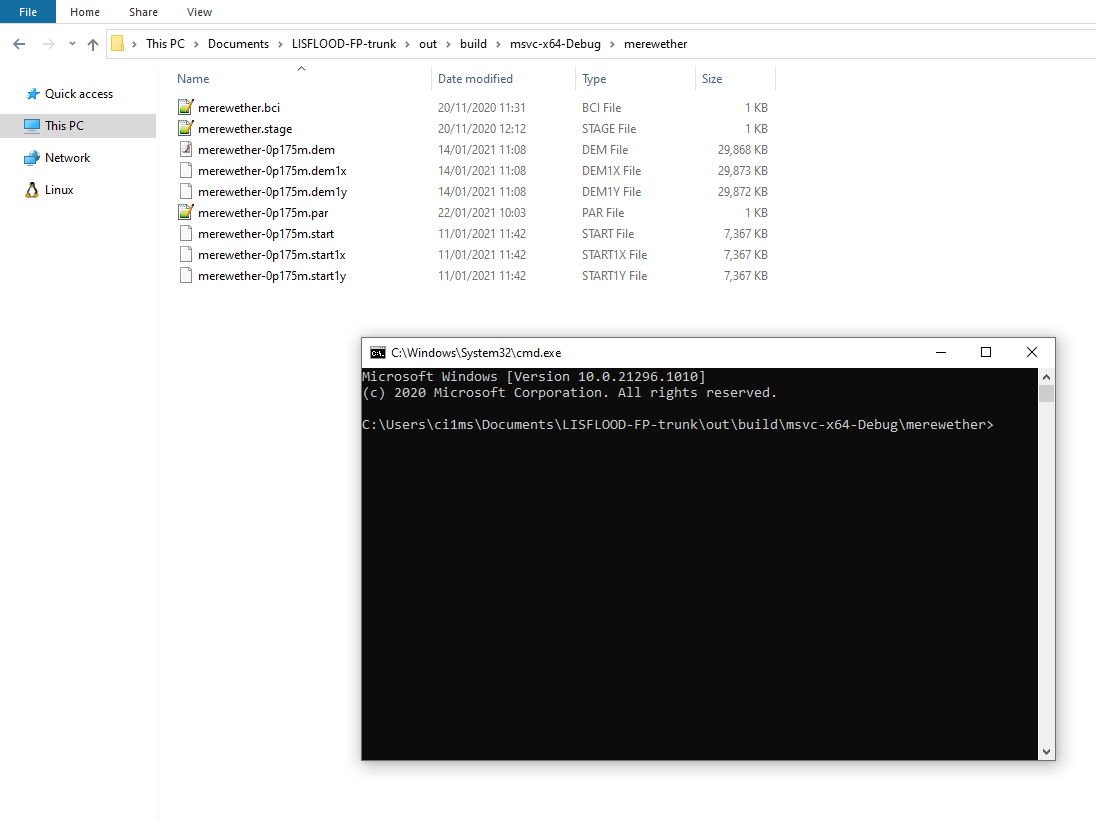
By clicking on the location bar of the Windows Explorer, then typing cmd and pressing Enter, the Command Prompt window will be opened in the folder, as shown in the figure below.
To run the simulation, the name of the executable must be entered in Command prompt, followed by the name of the .par file:
..\lisflood.exe merewether-0p175m.par
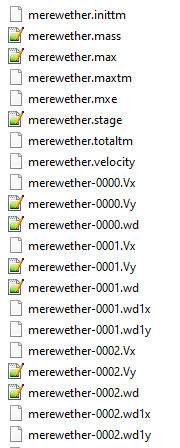
When the simulation is finished, a series of files, named according to the item resroot given in the .par file, (i.e. merewether for the Merewether test case) will be generated. These files will be located in a directory named by the item dirroot in the .par file, as shown in the figure below.
For running lisflood from a linux-based platform, different instructions must be followed (see the demo on how to run the Merewether test case on the HPC platform of the University of Sheffied.
Running on eiher platform will produce the following output files:
-
Water depth or free-surface elevation output files (
-xxxx.wd,-xxxx.elev) -
Maximum water depth (
.max) and maximum free-surface elevation (.mxe) output files
The 2D output raster files can be viewed in QGIS, in the same manner explained in “Viewing the DEM data on QGIS”. The text output files, i.e. .mass, .stage or .velocity, can be visualized in any spreadsheet software like MS Excel.