SEAMLESS-WAVE

SEAMLESS-WAVE is a developing “SoftwarE infrAstructure for Multi-purpose fLood modElling at variouS scaleS” based on "WAVElets" and their versatile properties. The vision behind SEAMLESS-WAVE is to produce an intelligent and holistic modelling framework, which can drastically reduce iterations in building and testing for an optimal model setting, and in controlling the propagation of model-error due to scaling effects and of uncertainty due statistical inputs.
Eden 2015 fluvial flooding
This test case aims to simulate fluvial flooding resulted from rainfall over a large catchment. It is selected to demonstrate how to set up a simulation on a domain with spatially-varying Manning coefficient, subject to spatially- and temporally-varying rainfall. The use of a post-processing toolkit for downscaling the coarse-resolution DG2 flood maps is also explained.
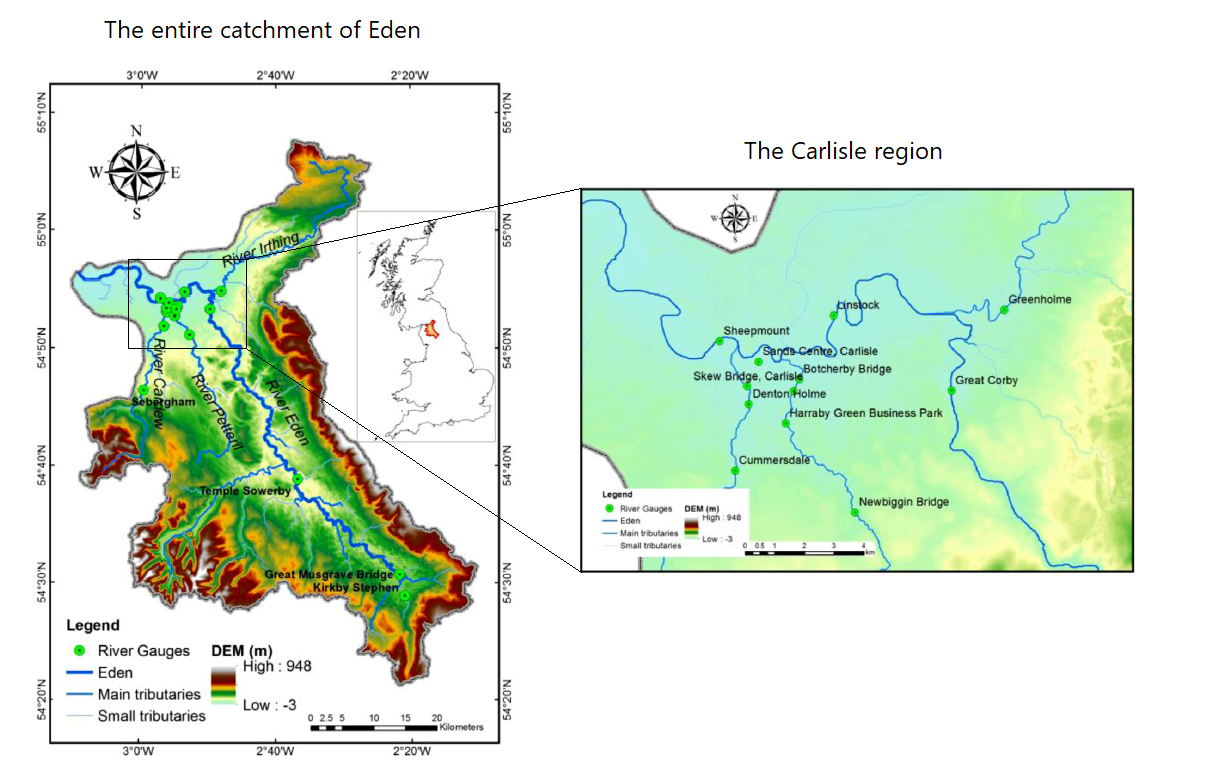
The LISFLOOD-FP is applied to reproduce the flood event caused by the 2015 Storm Desmond, which brought heavy rainfall to the 2500 square kilometres Eden Catchment. The figure below shows a map of the Eden catchment (Xia et al., 2019). There are four major rivers in the catchment, including River Eden and its three tributaries, i.e. River Irthing, River Petteril and River Caldew. River Eden merges with the three tributaries as it passes through Carlisle, which was the most flooded city during the Storm Desmond event. There are 16 gauges (as marked in the figure below, right panel) located in the four rivers for monitoring water levels and discharges.
For setting up the test case the Digital Elevation Mode (DEM) over the whole catchment is required. The 5 m × 5 m resolution DEM data, named eden-5m.dem, is provided by School of Architecture, Building and Civil Engineering at Loughborough University. It was created by further processing the LiDAR DEM provided by the UK Ordnance Survey (Ordnance Survey, 2018) and improved by incorporating the locations and heights of flood defences published by the Environmental Agency (Environment Agency, 2018).
The Manning coefficient is assigned over the domain according to different land-use types: inside the river channel the value of the coefficint is equal to 0.055, while over floodplain and hillslope it is equal to 0.075. The Manning coefficient data is provided in a file named eden-5m.n (recall “Floodplain friction Manning’s coefficient file (.n)”). To use the Manning coefficient file, the item manningfile must be includeed in the .par file of this test case (namely eden-5m.par), followed by the name of the file (recall “Parameter file (.par)”).
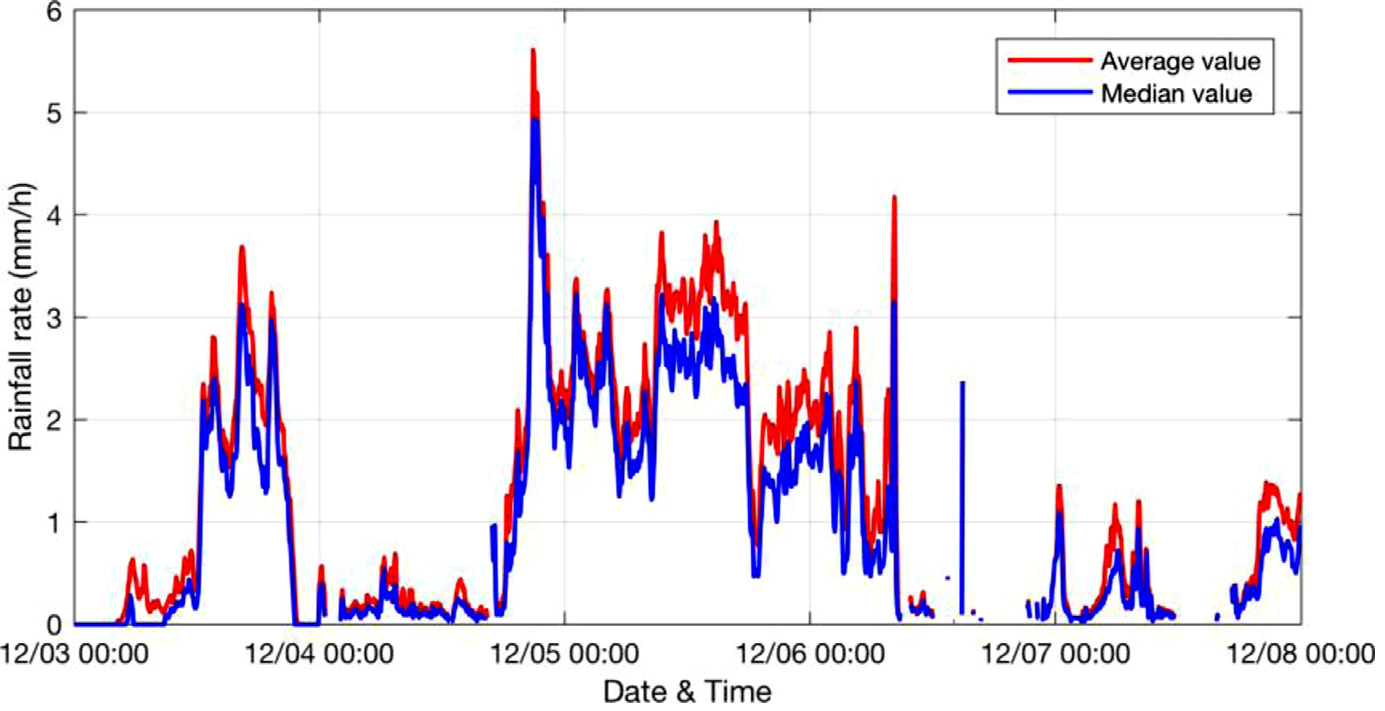
The spatially- and temporally-varying rainfall data is provided by the UK Met-Office. The data is at 1 km × 1 km spatial resolution and 5 min temporal resolution and is provided in a NetCDF file named eden-5m.nc (recall “Spatially- and temporarily-varying rainfall file (.nc)”). To use the rainfall file, the item dynamicrainfile must be includeed in eden-5m.par, followed by the name of the file (recall “Parameter file (.par)”). The figure below shows the time series of the average and median rainfall intensity over the catchment during Storm Desmond.
All the input files required to run the simulations are provided for UoS users in the testing\UoS\T08 directory of LISFLOOD-FP-trunk repository, and for external users in Data\T08 (recall “Input files and their format”). The simulations are run using the ACC, FV1 and DG2 solvers, starting at 00:00 3 December 2015 over an initially dry bed, and ending at 12:00 8 December 2015.
Using the original 5 m × 5 m resolution DEM for the Eden catchment leads to a grid with over 200 million computational cells. Although running a simulation using the ACC solver might be affordable, using the FV1/DG2 solver over such a large grid will be very time-consuming. Previous studies have shown that running FV1 on a 10 m × 10 m or 20 m × 20 m resolution is sufficient to simulate observed flood extent and river levels (Xia et al., 2019). Compared to the FV1 solver, the DG2 solver can deliver the same quality of results on coarser grids (Ayog et al., 2021). Therefore, the ACC and FV1 simulations are performed over a 20 m × 20 m grid, while the DG2 simulation is run on a coarser 40 m × 40 m grid.
The figure below shows the free-surface elevations at four stage points of Sheepmount, Sands Centre, Linstock and Great Corby. The predictions made by the DG2 solver on a 2x coarser resolution of 40 m × 40 m, are generally closer to the measurements compared to the predictions from the ACC and FV1 solvers on the 20 m × 20 m grid. This enhanced predictive capability of the DG2 solver is a result of the second-order accurate, piecewise-planar representation of terrain and flow variables (for detailed analyses see Shaw et al. (2021)).

Although DG2 the coarser grid of 40 m x 40 m predicts free surface elevations (at the stage points) that are comparable to those predicted by FV1 and ACC on the finer grid, it might still lead to relatively crude 2D water depth maps. The figure below (from left to right) shows the water depth maps at 12:00 5 December, over Carlisle city centre predicted by the FV1 and ACC solvers, and that of the DG2 using only its average-coefficients (instead of the full piecewise-planar data based on both average- and slope-coefficients). As the figure shows, the coarse DG2 water depth map leads to a crude representation of the flood extent and the water depth values inside the river channel.

This crude representation can be alleviated by fully exploiting the DG2’s piecewise-planar representation of the data and downscaling the coarse 40 m × 40 m resolution maps to higher resolution at 20 m × 20 m. To downscale the coarse-resolution DG2 flood maps, a post-processing toolkit, named DG2downscale, is provided in the postprocess directory of LISFLOOD-FP-trunk repository. The downscaling process and how to use the toolkit is described in “Downscaling coarse-resolution DG2 flood maps”.
The figure below shows the DG2 water depth map on the 40 m × 40 m resolution (left) compared to the downscaled water depth map at 20 m × 20 m resolution. It can be seen that the downscaling from the full DG2’s piecewise-planar representation improves the accuracy of the flood extent and the water depth values shown inside the river channel.
